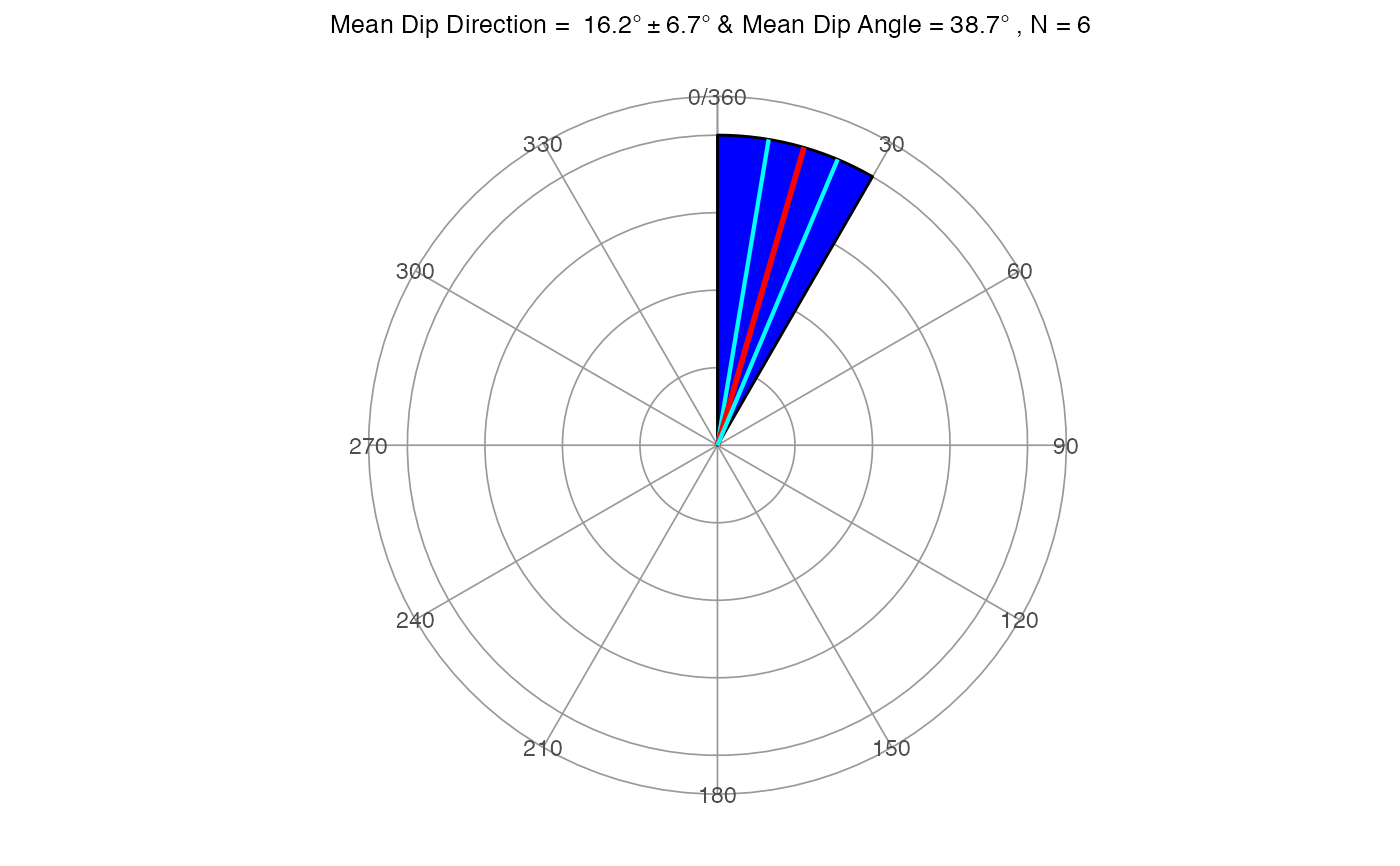
Plots a rose diagram for angular (direction and dip) data.
rose_diag_3D(az, dip, width = 30, dir = 1, conf.level = 0.95)
Arguments
| az | A vector of directions in degrees |
|---|---|
| dip | A vector of dip angles in degrees |
| width | Petal width |
| dir | A logical indicating if the data are directional (1) or non-directional (0) |
| conf.level | Confidence level to use for the cone of confidence (Default is 0.95) |
Value
A ggplot obejct
Details
The mean direction and cone of confidence are displayed as red and cyan lines respectively. If non-directional data is provided it must follow the right-hand rule.
Examples
dip.dir = c(12,18,22,15,10,20)
strike = d2s(dip.dir)
dip = c(42,40,48,30,42,30)
rose_diag_3D(dip.dir, dip)
