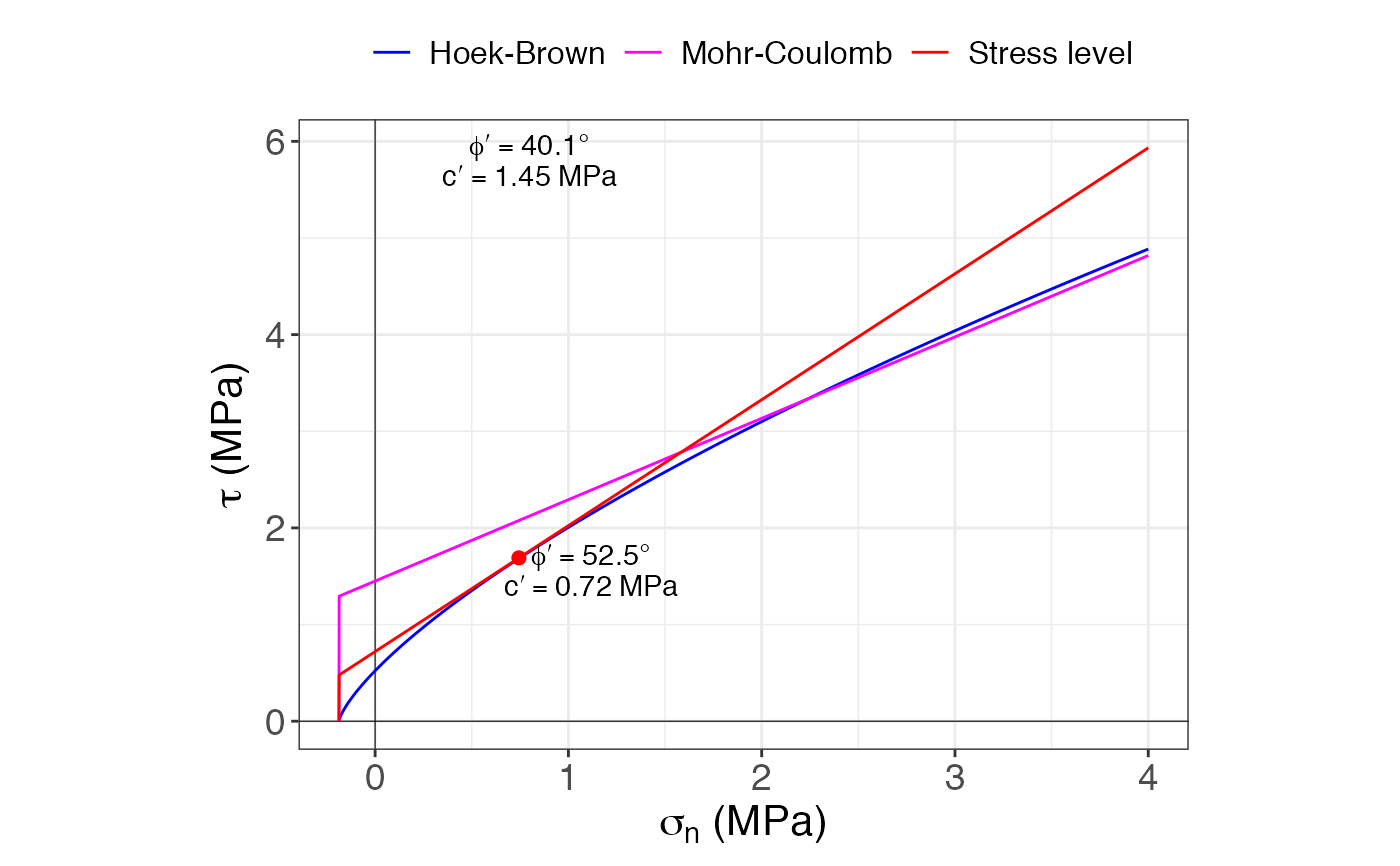
Draws the Hoek-Brown criterion for the given data and for the given level of stress (unit weight and depth).
Hoek_Brown_plot(HB)
Arguments
| HB | The result from running |
|---|
Value
A list with two ggplot objects for the Hoek-Brown criterion (principal stresses and normal-shear stresses)
References
Hoek, E. & Brown, E. T. (1980). Empirical strength criterion for rock masses. J. Geotech. Eng. Div. ASCE 106 (GT9): 1013-1035.
Hoek, E., Carranza-Torres, C. & Corkum, B. (2002). Hoek-Brown Failure Criterion - 2002 Edition. Proc. NARMS-TAC Conference, Toronto. 267-273.
Hoek, E. & Marinos, P. (2007). A brief history of the development of the Hoek-Brown criterion. Soils and Rocks, No. 2.
Examples
sig.ci = 16 GSI = 75 mi = 13 MR = 300 D = 0 height = 40 unit.weight = 18.6 HB = Hoek_Brown(sig.ci, GSI, mi, MR, D, height, unit.weight) Hoek_Brown_plot(HB)#> $princ.stresses#> #> $normal.shear#>

