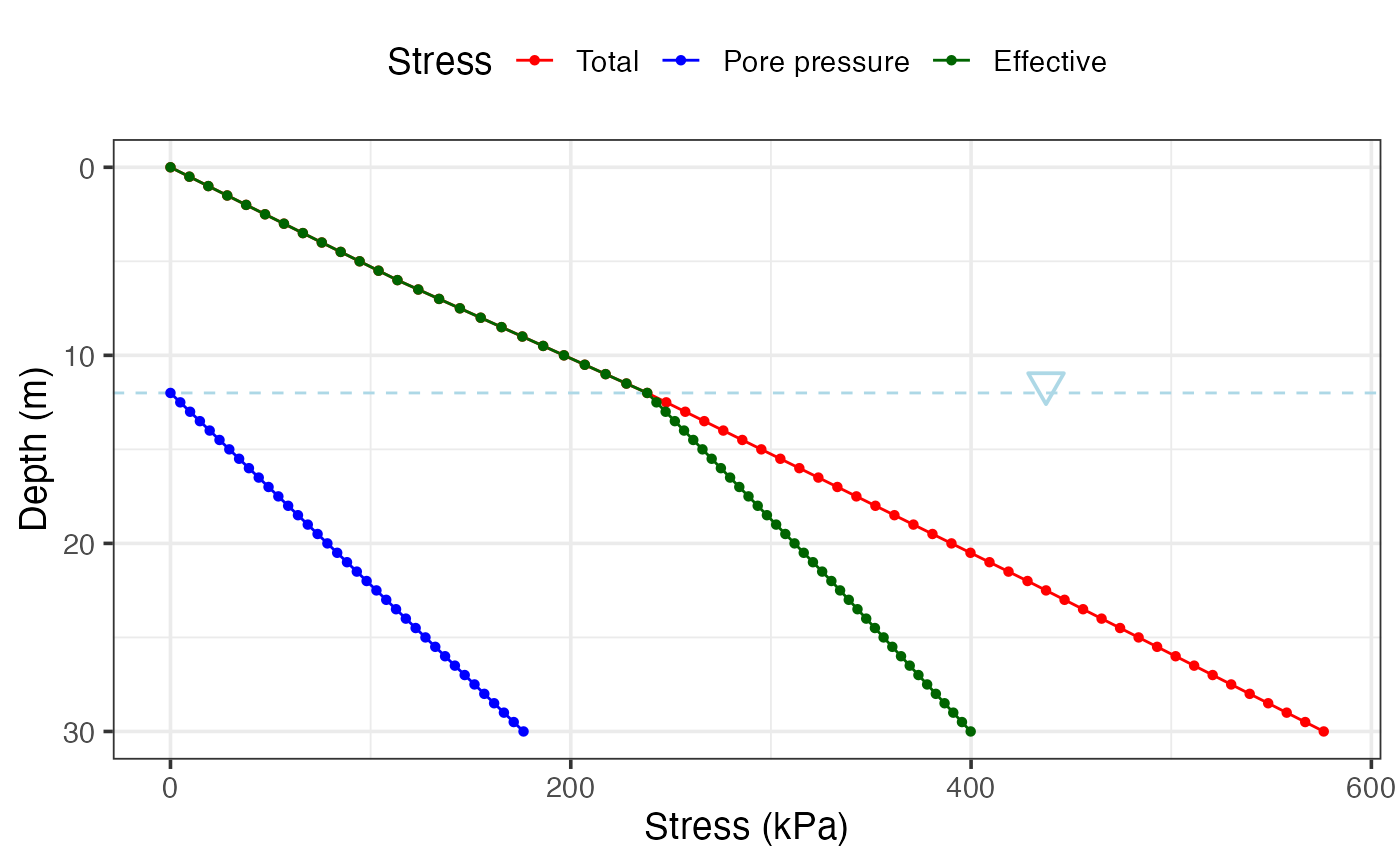
Builds a depth profile of total stress, pore pressure, and effective stress, and returns both the data and a plot.
Arguments
- boundaries
Numeric vector of layer boundaries (m), in increasing order. For example,
c(6, 12, 22, 30).- soils
Character vector of soil names for each layer (length must be
length(boundaries)).- unit_weights
Numeric vector of unit weights (kN/m^3) for each layer (length must be
length(boundaries)).- NF
Numeric scalar. Water table depth (m). Use
NA_real_to omit pore pressure.- step
Depth increment (m) used to discretize the profile. Default is
0.5.
Value
A list with:
- Profile
A tibble with depth, layer, unit weight, total stress, pore pressure, and effective stress.
- Graph
A ggplot2 object.
See also
Other soil mechanics:
Casagrande_LL(),
DS_plot(),
Mohr_Circle(),
bearing_capacity(),
compaction_test(),
fallcone_limits(),
induced_stress(),
particle_size_graph()
Examples
boundaries <- c(6, 12, 22, 30)
soils <- c("Sansy silt", "Fine sand", "Clay", "Gravel")
unit_weights <- c(18.9, 20.8, 19, 18.5)

res <- insitu_stress(boundaries, soils, unit_weights, NF = 12)
res$Profile
#> # A tibble: 61 × 6
#>    Depth Soil       Unit_Weight Total_Stress Pore_Pressure Effective_Stress
#>    <dbl> <fct>            <dbl>        <dbl>         <dbl>            <dbl>
#>  1   0   Sansy silt        18.9         0               NA             0
#>  2   0.5 Sansy silt        18.9         9.45            NA             9.45
#>  3   1   Sansy silt        18.9        18.9             NA            18.9
#>  4   1.5 Sansy silt        18.9        28.4             NA            28.4
#>  5   2   Sansy silt        18.9        37.8             NA            37.8
#>  6   2.5 Sansy silt        18.9        47.2             NA            47.2
#>  7   3   Sansy silt        18.9        56.7             NA            56.7
#>  8   3.5 Sansy silt        18.9        66.2             NA            66.2
#>  9   4   Sansy silt        18.9        75.6             NA            75.6
#> 10   4.5 Sansy silt        18.9        85.1             NA            85.1
#> # ℹ 51 more rows
res$Graph
#> Warning: Removed 24 rows containing missing values or values outside the scale range
#> (`geom_line()`).
#> Warning: Removed 24 rows containing missing values or values outside the scale range
#> (`geom_point()`).