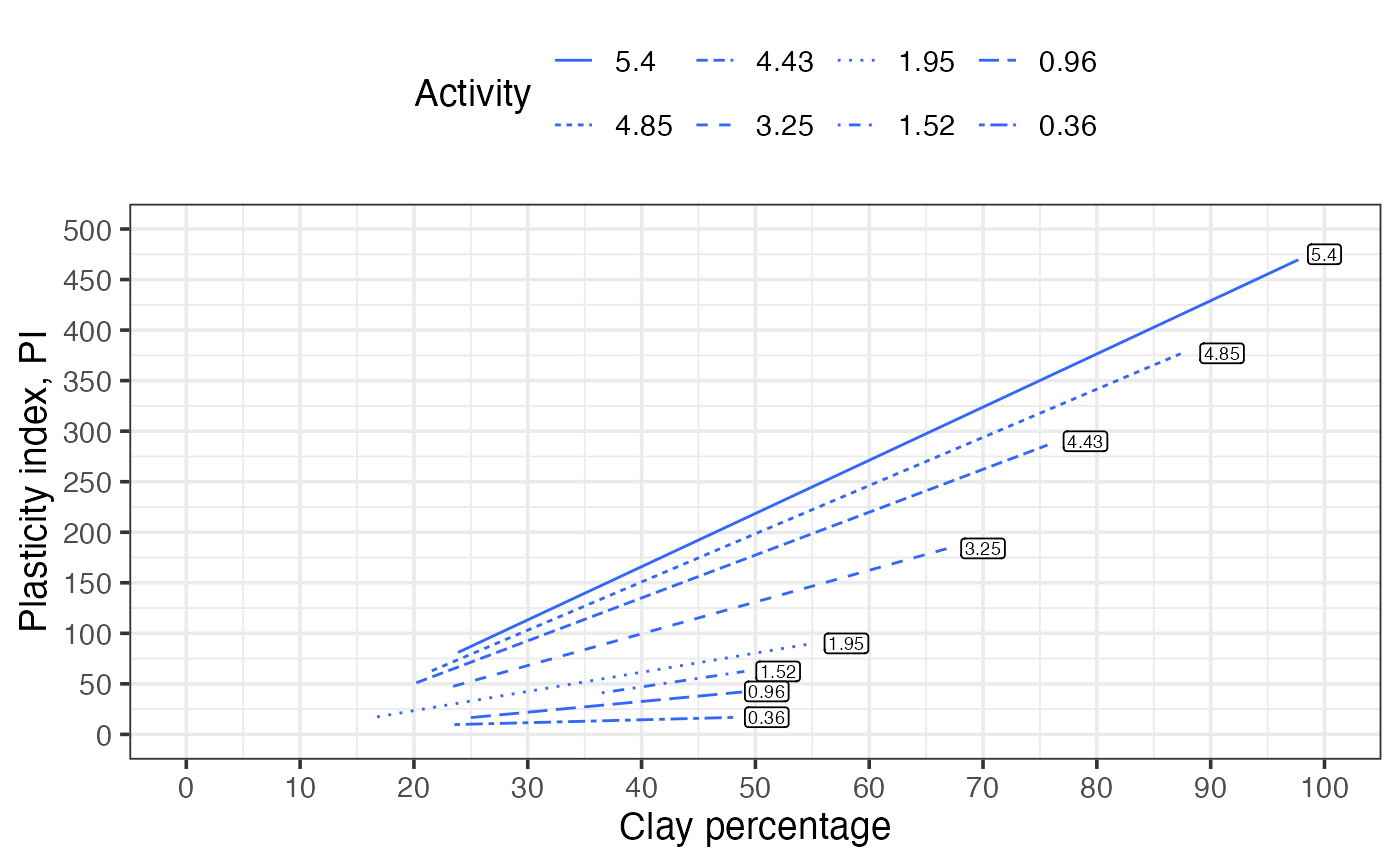
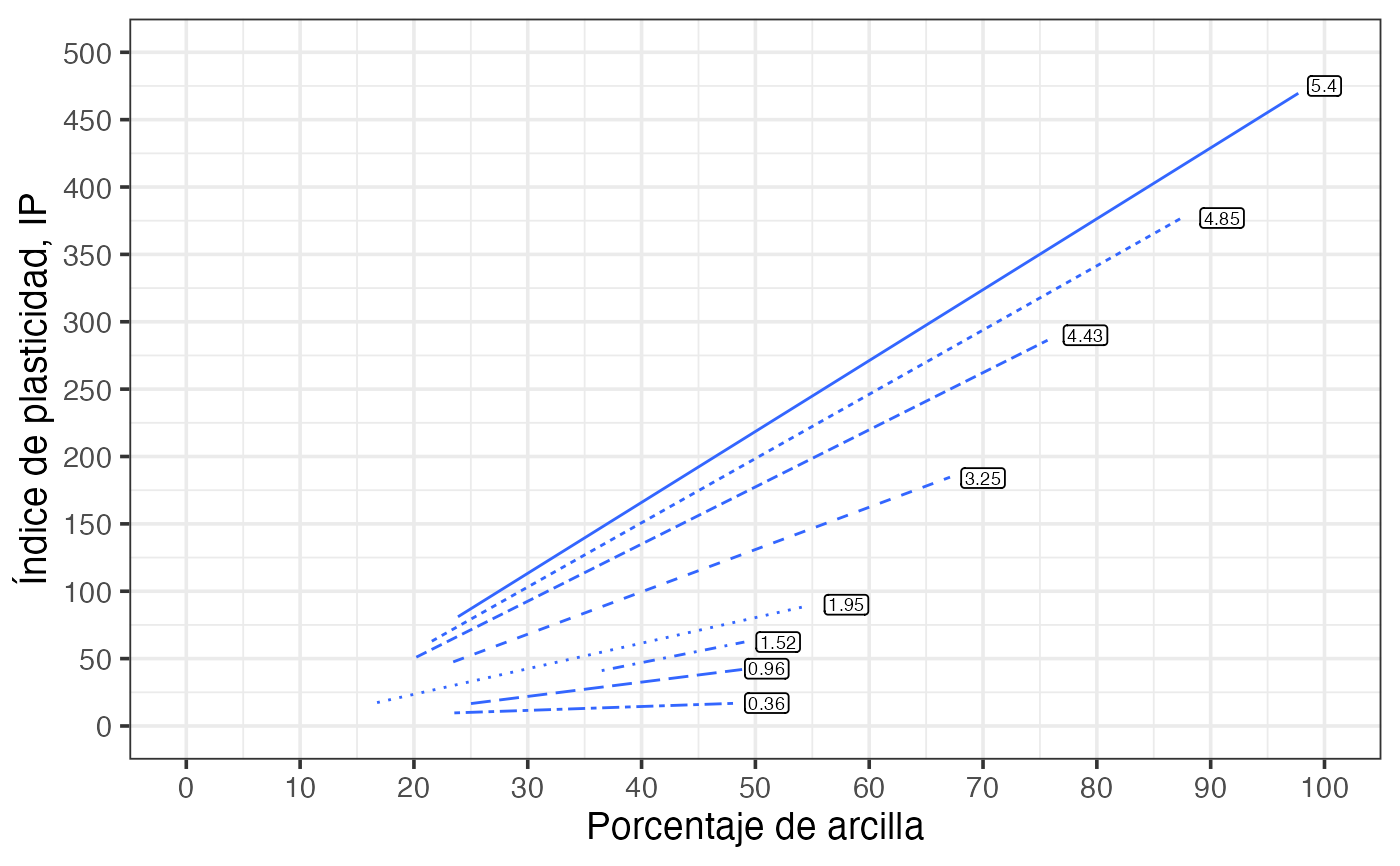
Draws a clay activity chart—plasticity index vs clay percentage—following. Reference lines for eight activity values are fitted by linear regression on built-in data and plotted as styled lines. Activity values are labelled directly on the chart and/or shown in a legend.
Usage
clay_activity(
  show.legend = T,
  legend.pos = "top",
  show.labels = T,
  labels.pos = "high",
  lang = "en"
)
Arguments
- show.legend
Logical. If
TRUE(default) a legend mapping line type to activity value is shown; ifFALSEthe legend is suppressed.- legend.pos
Character. Position of the legend passed to
theme(legend.position = ...). Default"top".- show.labels
Logical. If
TRUE(default) activity values are annotated directly on the reference lines; ifFALSE` labels are omitted.- labels.pos
Character. Position of the direct labels:
"high"(default) places labels near the top of the plot;"low"places labels near the bottom.- lang
Character. Language for axis titles:
"en"(default) for English,"es"for Spanish.
Value
A ggplot object with clay percentage on the x-axis (0–100) and plasticity index on the y-axis (0–500), containing the eight reference activity lines and optional direct labels.
References
Das, B. M., & Sobhan, K. (2018). Principles of geotechnical engineering (Ninth edition). Cengage Learning.
See also
Other classification plots, soil mechanics:
Casagrande_chart(),
soil_collapse(),
soil_expansion(),
soil_swelling(),
ternary_shepard(),
ternary_usda()