Second-Order Inverse Polynomial Model
Source:R/self_starting_nls.R, R/self_starting_drc.R
invpoly2.RdThese functions provide Second-Order Inverse Polynomial Model equation (invpoly2.fun()), as well as the self-starters for the nls() (SSinvpoly2()) and drc::drm() functions (DRCinvpoly2()).
Arguments
- x
A numeric vector of non-zero positive values (e.g., dose, time).
- a
The coefficient of the \(1/x\) term in the linearised form. Controls the initial rise of the curve near the origin.
- b
The coefficient of the linear term in the denominator. Along with
c, determines the location and height of the response peak.- c
The coefficient of the quadratic term in the denominator. A positive value causes the curve to decline after reaching a maximum, producing a unimodal response.
Value
invpoly2.fun() and SSinvpoly2() return a numeric value, while DRCinvpoly2() returns a list containing the nonlinear function and the self starter function.
Details
The model is defined as:
$$y = \frac{x}{a + b x + c x^2}$$
where a controls the initial rise near the origin, b is the
linear term in the denominator, and c is the quadratic term. A
positive c causes the curve to reach a maximum and subsequently
decline, producing a unimodal response.
Unlike the first-order model SSinvpoly1(), the quadratic term in the
denominator allows the curve to reach a maximum and subsequently decline,
making it suitable for unimodal dose-response relationships.
See also
Other non-linear functions, self-starters:
chaprich.fun(),
exp3.fun(),
expneg.fun(),
expneg2.fun(),
invpoly1.fun(),
invpoly3.fun(),
kostmod.fun(),
varexp.fun(),
vargauss.fun(),
varsph.fun()
Examples
x <- seq(1, 20, length.out = 50)
y <- invpoly2.fun(x, a = 1, b = 0.5, c = 0.02) + rnorm(50, sd = 0.05)
df <- data.frame(x = x, y = y)
mod = nls(y ~ SSinvpoly2(x, a, b, c), data = df)
summary(mod)
#>
#> Formula: y ~ SSinvpoly2(x, a, b, c)
#>
#> Parameters:
#> Estimate Std. Error t value Pr(>|t|)
#> a 0.886425 0.073827 12.01 6.36e-16 ***
#> b 0.527991 0.025684 20.56 < 2e-16 ***
#> c 0.017986 0.001615 11.14 8.79e-15 ***
#> ---
#> Signif. codes: 0 ‘***’ 0.001 ‘**’ 0.01 ‘*’ 0.05 ‘.’ 0.1 ‘ ’ 1
#>
#> Residual standard error: 0.05142 on 47 degrees of freedom
#>
#> Number of iterations to convergence: 2
#> Achieved convergence tolerance: 4.586e-06
#>
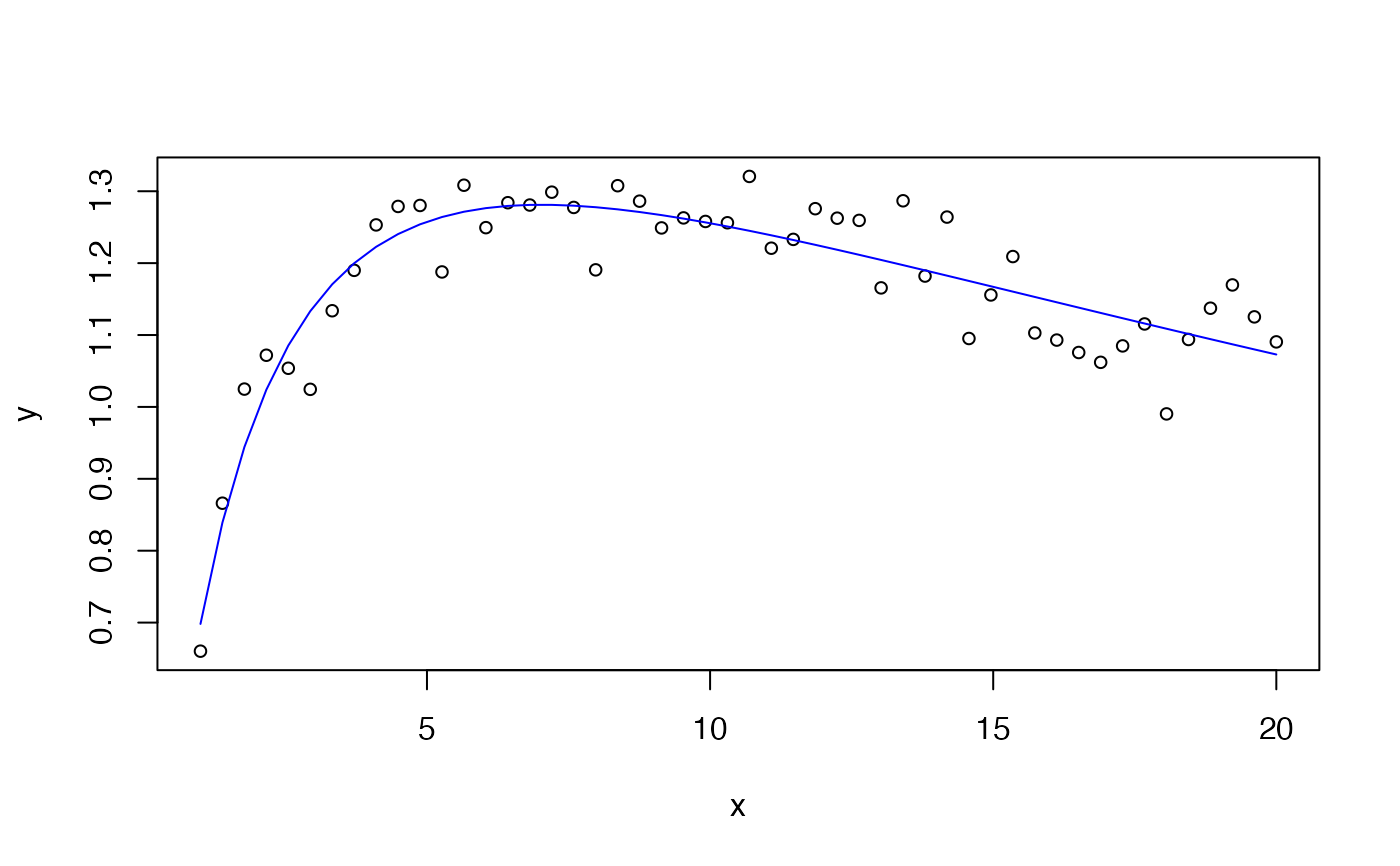
plot(x, y, cex = 0.8)
lines(x, predict(mod), col = 'blue')
 if (FALSE) { # \dontrun{
mod = drc::drm(y ~ x, data = df, fct = DRCinvpoly2())
summary(mod)
plot(mod, log = "")
} # }
if (FALSE) { # \dontrun{
mod = drc::drm(y ~ x, data = df, fct = DRCinvpoly2())
summary(mod)
plot(mod, log = "")
} # }